Embedded Wizard Studio: Log window
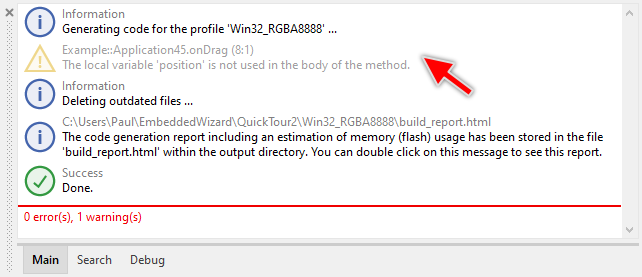
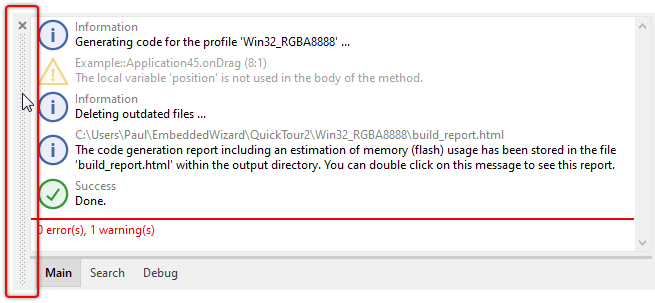
The Log window displays status reports, warnings and errors occurred during working with Embedded Wizard. Similarly all project search results and the prototyping and debugging outputs are collected in this window. The window is arranged per default in the bottom-left area of Embedded Wizard Studio:
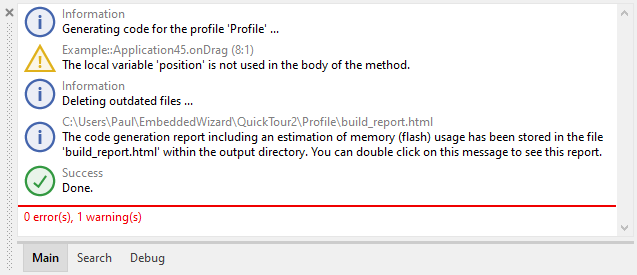
Log window
The messages are divided in the categories Main, Search and Debug. The first category Main collects all messages reported while working with Embedded Wizard. This includes error messages, warnings as well as all status and information reports. The second category Search is intended to collect all outputs produced by the project search operation. Finally, the third category Debug collects all messages generated by the trace or tracestack statement and is as such useful when testing and debugging the application.
Within each category the messages are displayed strictly in the order in which they have been collected. Every message is decorated with an individual icon reflecting the message type. If the message is related to a particular location within the project, this location appears in the message upper text row. In the case the message is not related to any project location, the upper row limits to show the generic type of the message only. Following table provides an overview of all message types:
Icon |
Type |
Description |
|---|---|---|
|
Information |
Messages of this type provide common information. Such messages appear to inform you, that a particular operation took place or just begun. |
|
Success |
Messages of this type inform you, that a particular operation was finalized successfully. |
|
Warning |
Messages of this type appear when a potential problem has been detected. You should inspect the message and eventually fix the problem. For example, when a local variable is declared but not used, a warning is reported. |
|
Error |
Messages of this type appear when a problem has been detected. You should inspect and fix the problem. For example, when a non existing variable is used within an expression, an error is reported. |
|
Runtime |
Messages of this type appear during prototyping and debugging of the GUI application when runtime errors are detected (e.g. division by zero) or exceptions are thrown by using the statement throw. |
|
Trace |
Messages of this type appear during prototyping and debugging of the GUI application when executing the trace or tracestack statement. |
|
Search |
Messages of this type appear during project search operation. For every occurrence matching the search condition a corresponding message appears in the Log window. |


Show the Log window
Usually the Log window is visible all the time. However, if you have hidden the window unintentionally, you can show it again:
★To show the Log window select the menu item .
★or use the keyboard shortcut Alt5.
Using the described menu item or the shortcut while the Log window is already visible causes the window to become focused only. Subsequently you can interact with the Log window by using the keyboard without the necessity to previously click on it with the mouse.
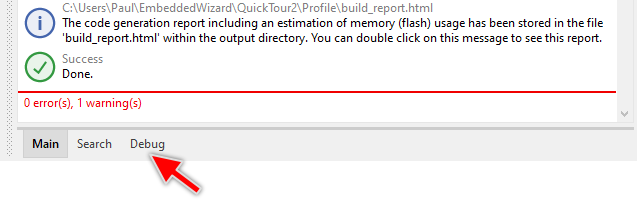
Switch between categories
The Log window collects the messages in three separate lists represented consequently by three tabs Main, Search and Debug. To switch between these categories:
★Click with the mouse on the corresponding tab.
★Or if the Log window is actually focused you can switch between the tabs also by using the shortcut CtrlTab.
When you start code generation or project search operation, the Log window switches to the corresponding list automatically. In all other cases if new messages are collected for an actually hidden list, the tab associated to the affected category starts to flash attracting so the attention of the user and informing the user that there are new not yet reviewed messages. The tab flashes in the color corresponding to the importance of the collected message, for example, yellow in case of a warning or red in case of an error:
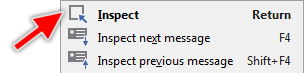
Inspect a message
Messages related to particular project members can be inspected causing the affected locations being shown in the Composer, Code Editor or Inspector window. This is usually the case of warning, error, search or debug messages.
★The simplest way to inspect a message is to double click on it.
Alternatively you can:
★Click on the message with right mouse button to open the context menu.
★In the context menu select the item .
As long as the Log window is focused you can inspect the messages also by using following keyboard shortcuts:
★Use the keys Up and Down to scroll the message list and select the desired message.
★Press the key Return to inspect the selected message.
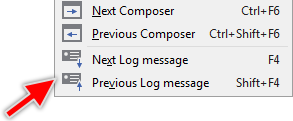
Inspect the next/previous message
Besides the above described approach to inspect a single Log window message Embedded Wizard provides functionality to simply traverse through the collected messages. This is in particular very useful when there is a lot of messages collected and you need to inspect all of them step by step.
★To inspect the next message following the currently selected (the last inspected) message press the key F4.
★or select in the main menu the item .
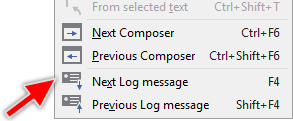
★To inspect the message preceding the currently selected message press the key ShiftF4.
★or select in the main menu the item .
Please note, that the function to traverse through the messages takes only those messages in account which in fact are related to a location within the project.
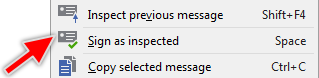
Status of a message
Messages which have been inspected appear in the Log window slightly grayed out. In this manner it is simply to recognize which messages have not yet been inspected and which are already evaluated.
If necessary the inspect status of a single message can be toggled individually.
★Click on the message with right mouse button to open the context menu.
★In the context menu select the item or depending on the current message status.
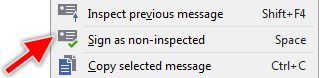
As long as the Log window is focused you can toggle the message status also by using following keyboard shortcuts:
★Use the keys Up and Down to scroll the message list and select the desired message.
★Press the key Space to toggle the status of the selected message between inspected and non-inspected.
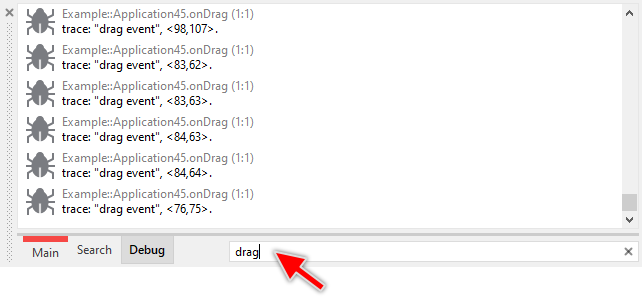
Filter debug messages
In the category Debug you can apply a filter pattern to the displayed messages and thus find the important debug or trace messages in a more convenient way. For this purpose the Log window provides in a Filter ... edit field. With the active filter function, the Log window displays only those messages, which in fact do match the specified filter pattern. Other messages are hidden:
★Since the filter functionality is available in Debug category only, you have to switch to this category first.
★Click on the Filter ... edit field.
★In the edit field enter the text you want to use as filter pattern:
A more advance approach is the usage of wildcard signs ? and * in the entered filter pattern. Here, the sign ? is assumed as representing exactly one arbitrary character within the message text. In turn the sign * can represent any arbitrary number of characters including even an empty text.
Please note, when using the wildcard signs, the message text has to match the complete specified pattern in order to be listed in the Log window. For example, the pattern *event matches only messages ending with the text event and starting with any arbitrary or even none text. In turn, the pattern event (without any wildcard signs) matches all messages containing the text event regardless of its position:
TIP
It is not absolutely necessary to click on the Filter ... edit field in order to enter the filter pattern. If the Log window is already focused, the Filter ... edit field is automatically activated as soon as you start entering the text. Moreover, you can toggle between the Filter ... edit field and the list view by pressing the key Tab.
Reset the filter
If desired you can reset the filter pattern again:
★For this purpose, click on the button  on the right of the Filter ... edit field:
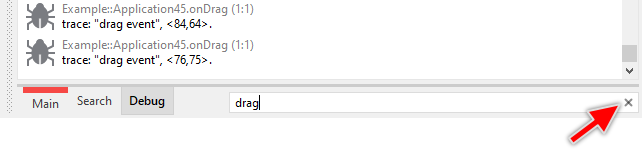
★... or simply press the key Escape if the Log window is currently focused.
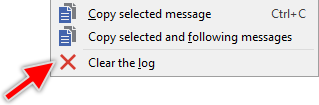
Clear the log
To remove all messages collected already within the actually shown list do following:
★Click within the Log window with right mouse button to open the context menu.
★In the context menu select the item .
Copy messages
Messages shown in the Log window can easily be copied as text into the clipboard. You can copy either a single selected message or the selected message together with all following messages. Subsequently, the copied messages can be pasted within an email, documentation, etc.
★Click within the Log window to select a message.
★Click with right mouse button to open the context menu.
★In the context menu select either to copy only the selected message, or to copy the selected message and all messages below it.
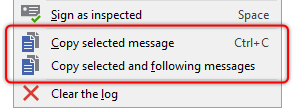
As long as the Log window is focused you can copy the selected message also by using following keyboard shortcut:
★Press the key CtrlC to copy the selected message to the clipboard.
Please note, in the category Debug you can apply a filter pattern to the displayed messages. If such filter is specified, the copy operation copies only those messages which do match the filter condition.
Use AI assistance to fix errors and warnings
If the Log window displays error or warning messages, you can utilize AI assistance to analyze and potentially fix the cause of these issues. The AI will process the selected message and attempt to resolve the underlying problem.
★Click within the Log window to select an error or warning message.
★Click with right mouse button to open the context menu.
★In the context menu select or depending on the type of message you have selected.
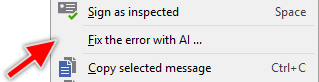
The selected error or warning message is now sent to the AI Console, where the AI analyzes the issue and attempts to fix its cause automatically.
Hide the window
Usually the Log window is visible all the time. If necessary the window can be hidden easily:
★To hide the Log window click on the small close button  at the border of the Log window.
Once hidden the Log window can be made visible again:
★To show the Log window select the menu item .
★or use the keyboard shortcut Alt5.
Undock the Log window
By default the Log window appears docked at the bottom-left corner of the Embedded Wizard main window. Accordingly, when you move or resize the main window the Log window is arranged automatically. If desired you can change this behavior and undock the Log window so it appears floating and independent above the main window. In this manner you can arrange it e.g. on another monitor. To achieve this:
★Double click within the grip area (the dotted bar) of the Log window.
Once the window is undocked and floating above the main window you can click on its caption and move it wherever it is convenient for you. If desired you can resize the window by clicking and dragging on its edges. If you want the Log window to appear again docked within the main window do following:
★Double click on the caption bar of the Log window. This causes the window to be docked at its associated dock position.
Note: Starting with version 15, the window management of Embedded Wizard Studio IDE has changed. While tool windows can still be docked or floating, docked positions are now fixed and predetermined. Unlike in earlier versions, you can no longer freely customize where windows are docked within the IDE.